Working with Cairo in your Jupyter Notebook
Cairo is a D vector graphics library that is nicely setup for both drawing to the screen or an image as well a generating postscript, PDF or SVG output. We'll be discussing it when we take a look at Cinder as an option for C++ application development in a later post.
So i thought it would be cool to build an interface to Cairo for working with 2D graphics in Jupyter notebooks. Which i assumed meant building a Python library interface for it. And low and behold, smart people had already taken on the task. There are several different options to chose from. Let's take a look.
Pycairo is the first one to look at. Python bindings for Cairo, just what the doctor ordered. The Pycairo bindings are designed to match the cairo C API as closely as possible. Cairo itself is kind of old school C in it's api design. If you already have Cairo code you want to just use in a Python Jupyter notebook, this may be the way to go.
Here's an example of how to use Pycairo.
Quhirah is the second one to take a look at. It provides a more “pythonic” API with less focus on matching the Cairo C API.
Quhira is implemented entirely in Python, using the ctypes module. This offers advantages, like automatic support for passing arguments by keyword, and argument names appearing in help() output. It also tries to operate at a higher level than the actual C-centric Cairo API, taking advantage of Python’s powerful data-manipulation facilities.
Of course if Cairo had a modern C++ interface, this particular 'pythonic' feature might already be available without having to resort to using Python. Take a look at OpenCV's templated datatypes for examples of what i mean by this.
Turns out there are already some Qahirah notebooks examples out there to check out. Let's take a look at the Path Technique one for a fun time. This notebook is an ipymb file, so of course we can use nbviewer to run it in a browser. Copy and paste the web link to the Path Technique Github ipymb file into the appropriate place a the top of the bviewer home page
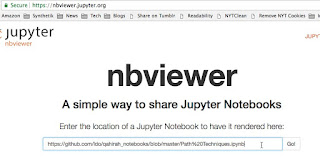 hit return or the Go button, and you are off and running.
 Well not really running, just seeing the static notebook. To run it, you need to press the 'execute on binder' button at the top
 And now you wait for Binder to start the repository for the notebook.
After it starts up, your notebook is live. You can then start pressing the Run button at the top of the notebook to start running different

The fillet demo at the bottom of the notebook is kind of fun since it has interactive controls you can adjust, and then watch the graphics it is generating adjust itself live.

So i thought it would be cool to build an interface to Cairo for working with 2D graphics in Jupyter notebooks. Which i assumed meant building a Python library interface for it. And low and behold, smart people had already taken on the task. There are several different options to chose from. Let's take a look.
Pycairo is the first one to look at. Python bindings for Cairo, just what the doctor ordered. The Pycairo bindings are designed to match the cairo C API as closely as possible. Cairo itself is kind of old school C in it's api design. If you already have Cairo code you want to just use in a Python Jupyter notebook, this may be the way to go.
Here's an example of how to use Pycairo.
#!/usr/bin/env python

import math
import cairo

WIDTH, HEIGHT = 256, 256

surface = cairo.ImageSurface(cairo.FORMAT_ARGB32, WIDTH, HEIGHT)
ctx = cairo.Context(surface)

ctx.scale(WIDTH, HEIGHT)  # Normalizing the canvas

pat = cairo.LinearGradient(0.0, 0.0, 0.0, 1.0)
pat.add_color_stop_rgba(1, 0.7, 0, 0, 0.5)  # First stop, 50% opacity
pat.add_color_stop_rgba(0, 0.9, 0.7, 0.2, 1)  # Last stop, 100% opacity

ctx.rectangle(0, 0, 1, 1)  # Rectangle(x0, y0, x1, y1)
ctx.set_source(pat)
ctx.fill()

ctx.translate(0.1, 0.1)  # Changing the current transformation matrix

ctx.move_to(0, 0)
# Arc(cx, cy, radius, start_angle, stop_angle)
ctx.arc(0.2, 0.1, 0.1, -math.pi / 2, 0)
ctx.line_to(0.5, 0.1)  # Line to (x,y)
# Curve(x1, y1, x2, y2, x3, y3)
ctx.curve_to(0.5, 0.2, 0.5, 0.4, 0.2, 0.8)
ctx.close_path()

ctx.set_source_rgb(0.3, 0.2, 0.5)  # Solid color
ctx.set_line_width(0.02)
ctx.stroke()

surface.write_to_png("example.png")  # Output to PNG
Quhirah is the second one to take a look at. It provides a more “pythonic” API with less focus on matching the Cairo C API.
Quhira is implemented entirely in Python, using the ctypes module. This offers advantages, like automatic support for passing arguments by keyword, and argument names appearing in help() output. It also tries to operate at a higher level than the actual C-centric Cairo API, taking advantage of Python’s powerful data-manipulation facilities.
What do we mean by 'old school C api approach' vs 'nifty pythonic api approach'? Let's say you are dealing with passing coordinates into Cairo for drawing operations. Cairo makes you specify all of the 2D coordinates you pass it as separate variables. So you have to say move_to(x,y) to move to the x,y coordinate. Quhira lets you use a Vector data type for a coordinate, so you only have to pass in one variable.
So
    p = Vector(x, y)
    ctx.move_to(p)

or
    ctx.move_to(Vector(x, y))

or even
    ctx.move_to((x, y))
Qahirah defines a *Colour* type, which takes advantage of the standard Python colorsys module to provide conversions between RGB colour space (the only one supported by Cairo) and HSV, HLS and YIQ colour spaces.Of course if Cairo had a modern C++ interface, this particular 'pythonic' feature might already be available without having to resort to using Python. Take a look at OpenCV's templated datatypes for examples of what i mean by this.
Turns out there are already some Qahirah notebooks examples out there to check out. Let's take a look at the Path Technique one for a fun time. This notebook is an ipymb file, so of course we can use nbviewer to run it in a browser. Copy and paste the web link to the Path Technique Github ipymb file into the appropriate place a the top of the bviewer home page


After it starts up, your notebook is live. You can then start pressing the Run button at the top of the notebook to start running different
The fillet demo at the bottom of the notebook is kind of fun since it has interactive controls you can adjust, and then watch the graphics it is generating adjust itself live.

Of course the first thing i did was go to the bottom fillet example and try to just run it. And i got an error message. Because it is dependent on running all of the code above it, since it calls some of it. So best to start from the top with that run button and work your way down to it.
If you wait for too long without doing anything, Binder apparently craps out. At that point i found it best to go back to nbviewer and submit the notebook file again (as opposed to trying to restart Binder).
If you run the notebook on your computer directly, then all of the Binder issues go away.
I need to play with this more before i totally pass judgment. But i think a case might be made for a simpler user interface for specifying the actual graphics. More on that in a later post.
Comments
Post a Comment